1. Early-Stage Research &
Insights
To avoid designing in a silo, I conducted a comprehensive competitive analysis, surveyed
community sentiment, and gathered core expectations from the Product Managers (PMs) of
various financial products. Following iterative research, I engaged in qualitative
interviews with over 10 investors using different brokerage applications. The final insights
were solidified after achieving alignment with over 70 internal stakeholders, including
Financial Product Department Heads, Financial Product PMs, Taipei Fubon Bank PMs, Data
Science PMs, IT Developers, and external vendors. Below is an excerpt of core user and
stakeholder feedback:
- "I want a clear, at-a-glance view of all the products
I've purchased, including my cost basis and overall asset trends." —
Investor C
- "I invest in a wide variety of products. It would be
much easier to manage my portfolio if I could clearly see where my largest positions
are." — Investor H
- "The asset overview in my current brokerage app doesn't
show dividend details; I always have to log out and check my bank account." —
Investor J
- "Internal teams emphasized the need for precise data
mapping (e.g., distinguishing book value from market value), clear historical
dividend tracking for wealth management clients, and resolving complex data logic
issues—such as currency conversions and reinvestment parameters—within the Data Mart
to prevent reconciliation errors." — Internal stakeholders -
Products
- "Raw data processing, field calculations, and data
transformation times must be
factored in. Definitions across different databases aren't always interoperable." —
Internal stakeholders -
Developers
2. Internal
Integration & Data
Architecture
Early research revealed that the most significant bottleneck was the misalignment between
existing database structures/calculations and the expectations of the Financial Product
Department. To accelerate data field integration, I facilitated cross-functional online
collaboration via cloud-based co-editing tools, aligning Financial Product PMs, Taipei Fubon
Bank PMs, Data Science PMs, and IT Developers.
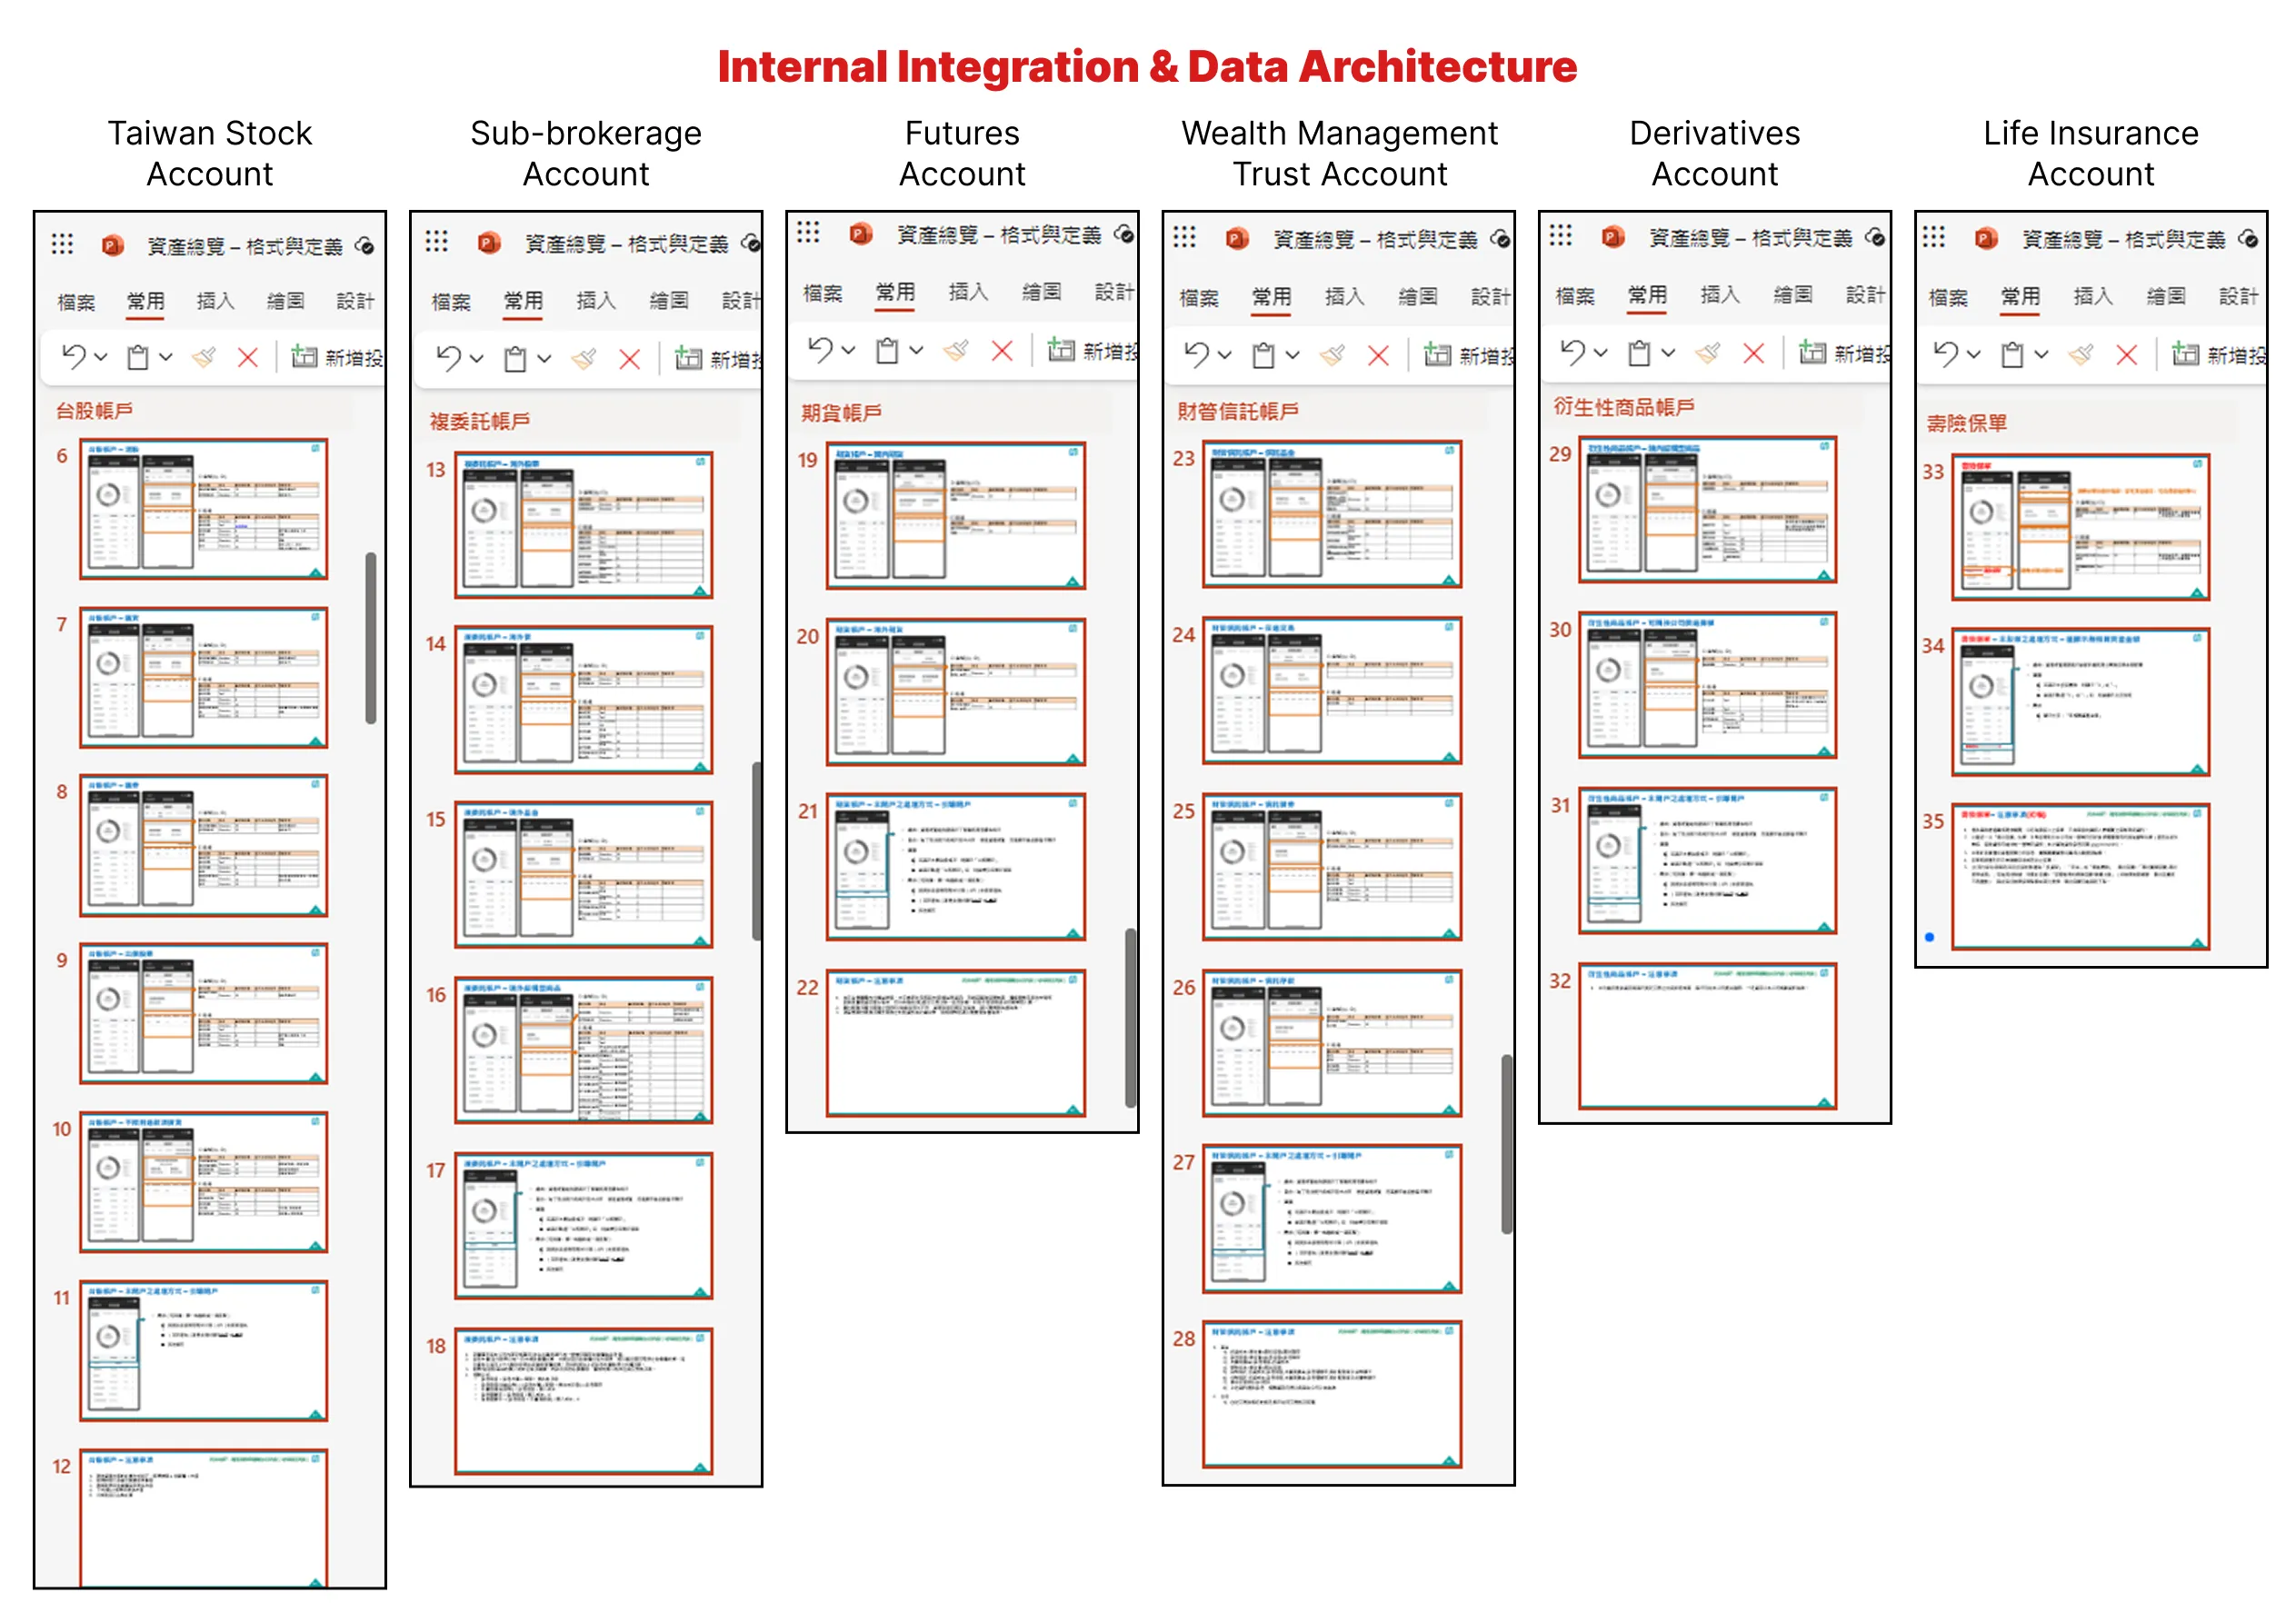
An example of Internal Integration & Data Architecture
[Confidentiality Notice] In compliance with
corporate Non-Disclosure Agreements (NDA), sensitive proprietary data has been
omitted. Only publicly shareable outcomes, such as internal collaboration strategies
and organizational frameworks, are presented.
Ultimately, we successfully mapped and finalized a
comprehensive set of complex data fields, ensuring that the data warehouse and raw data
allowed for accurate data cleansing and computation.
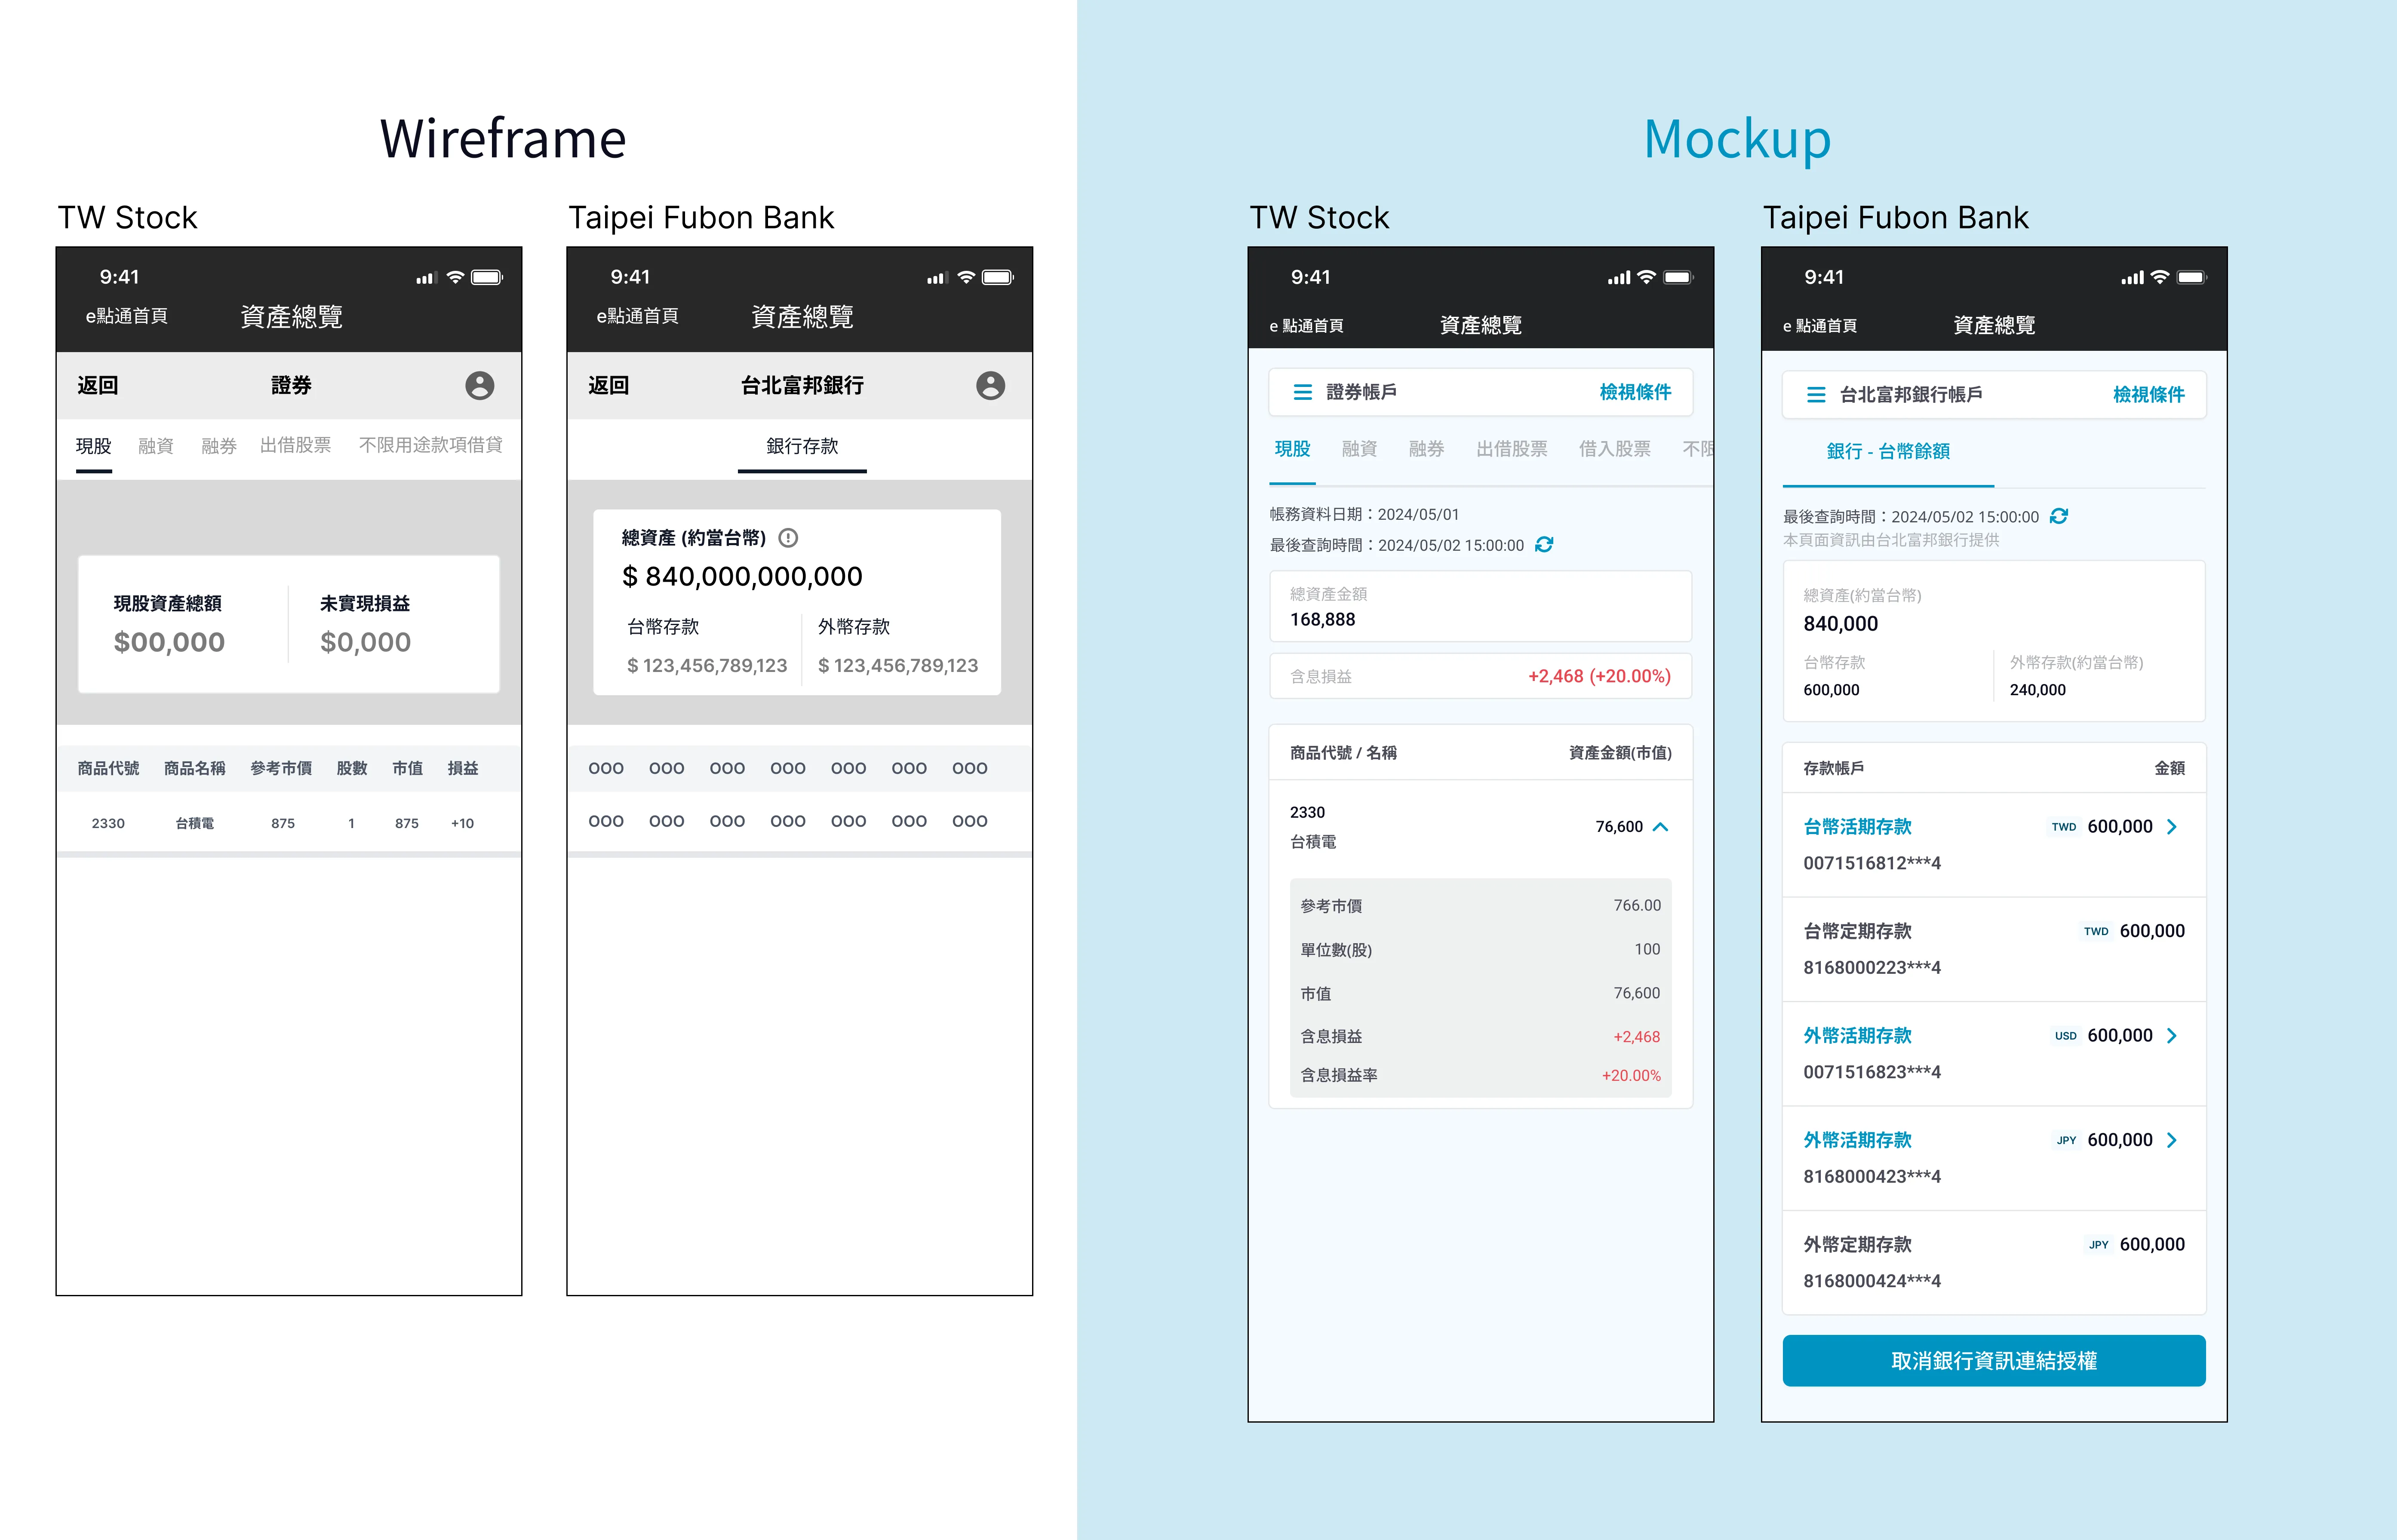
3. Wireframing - From Initial Draft to
Refinement
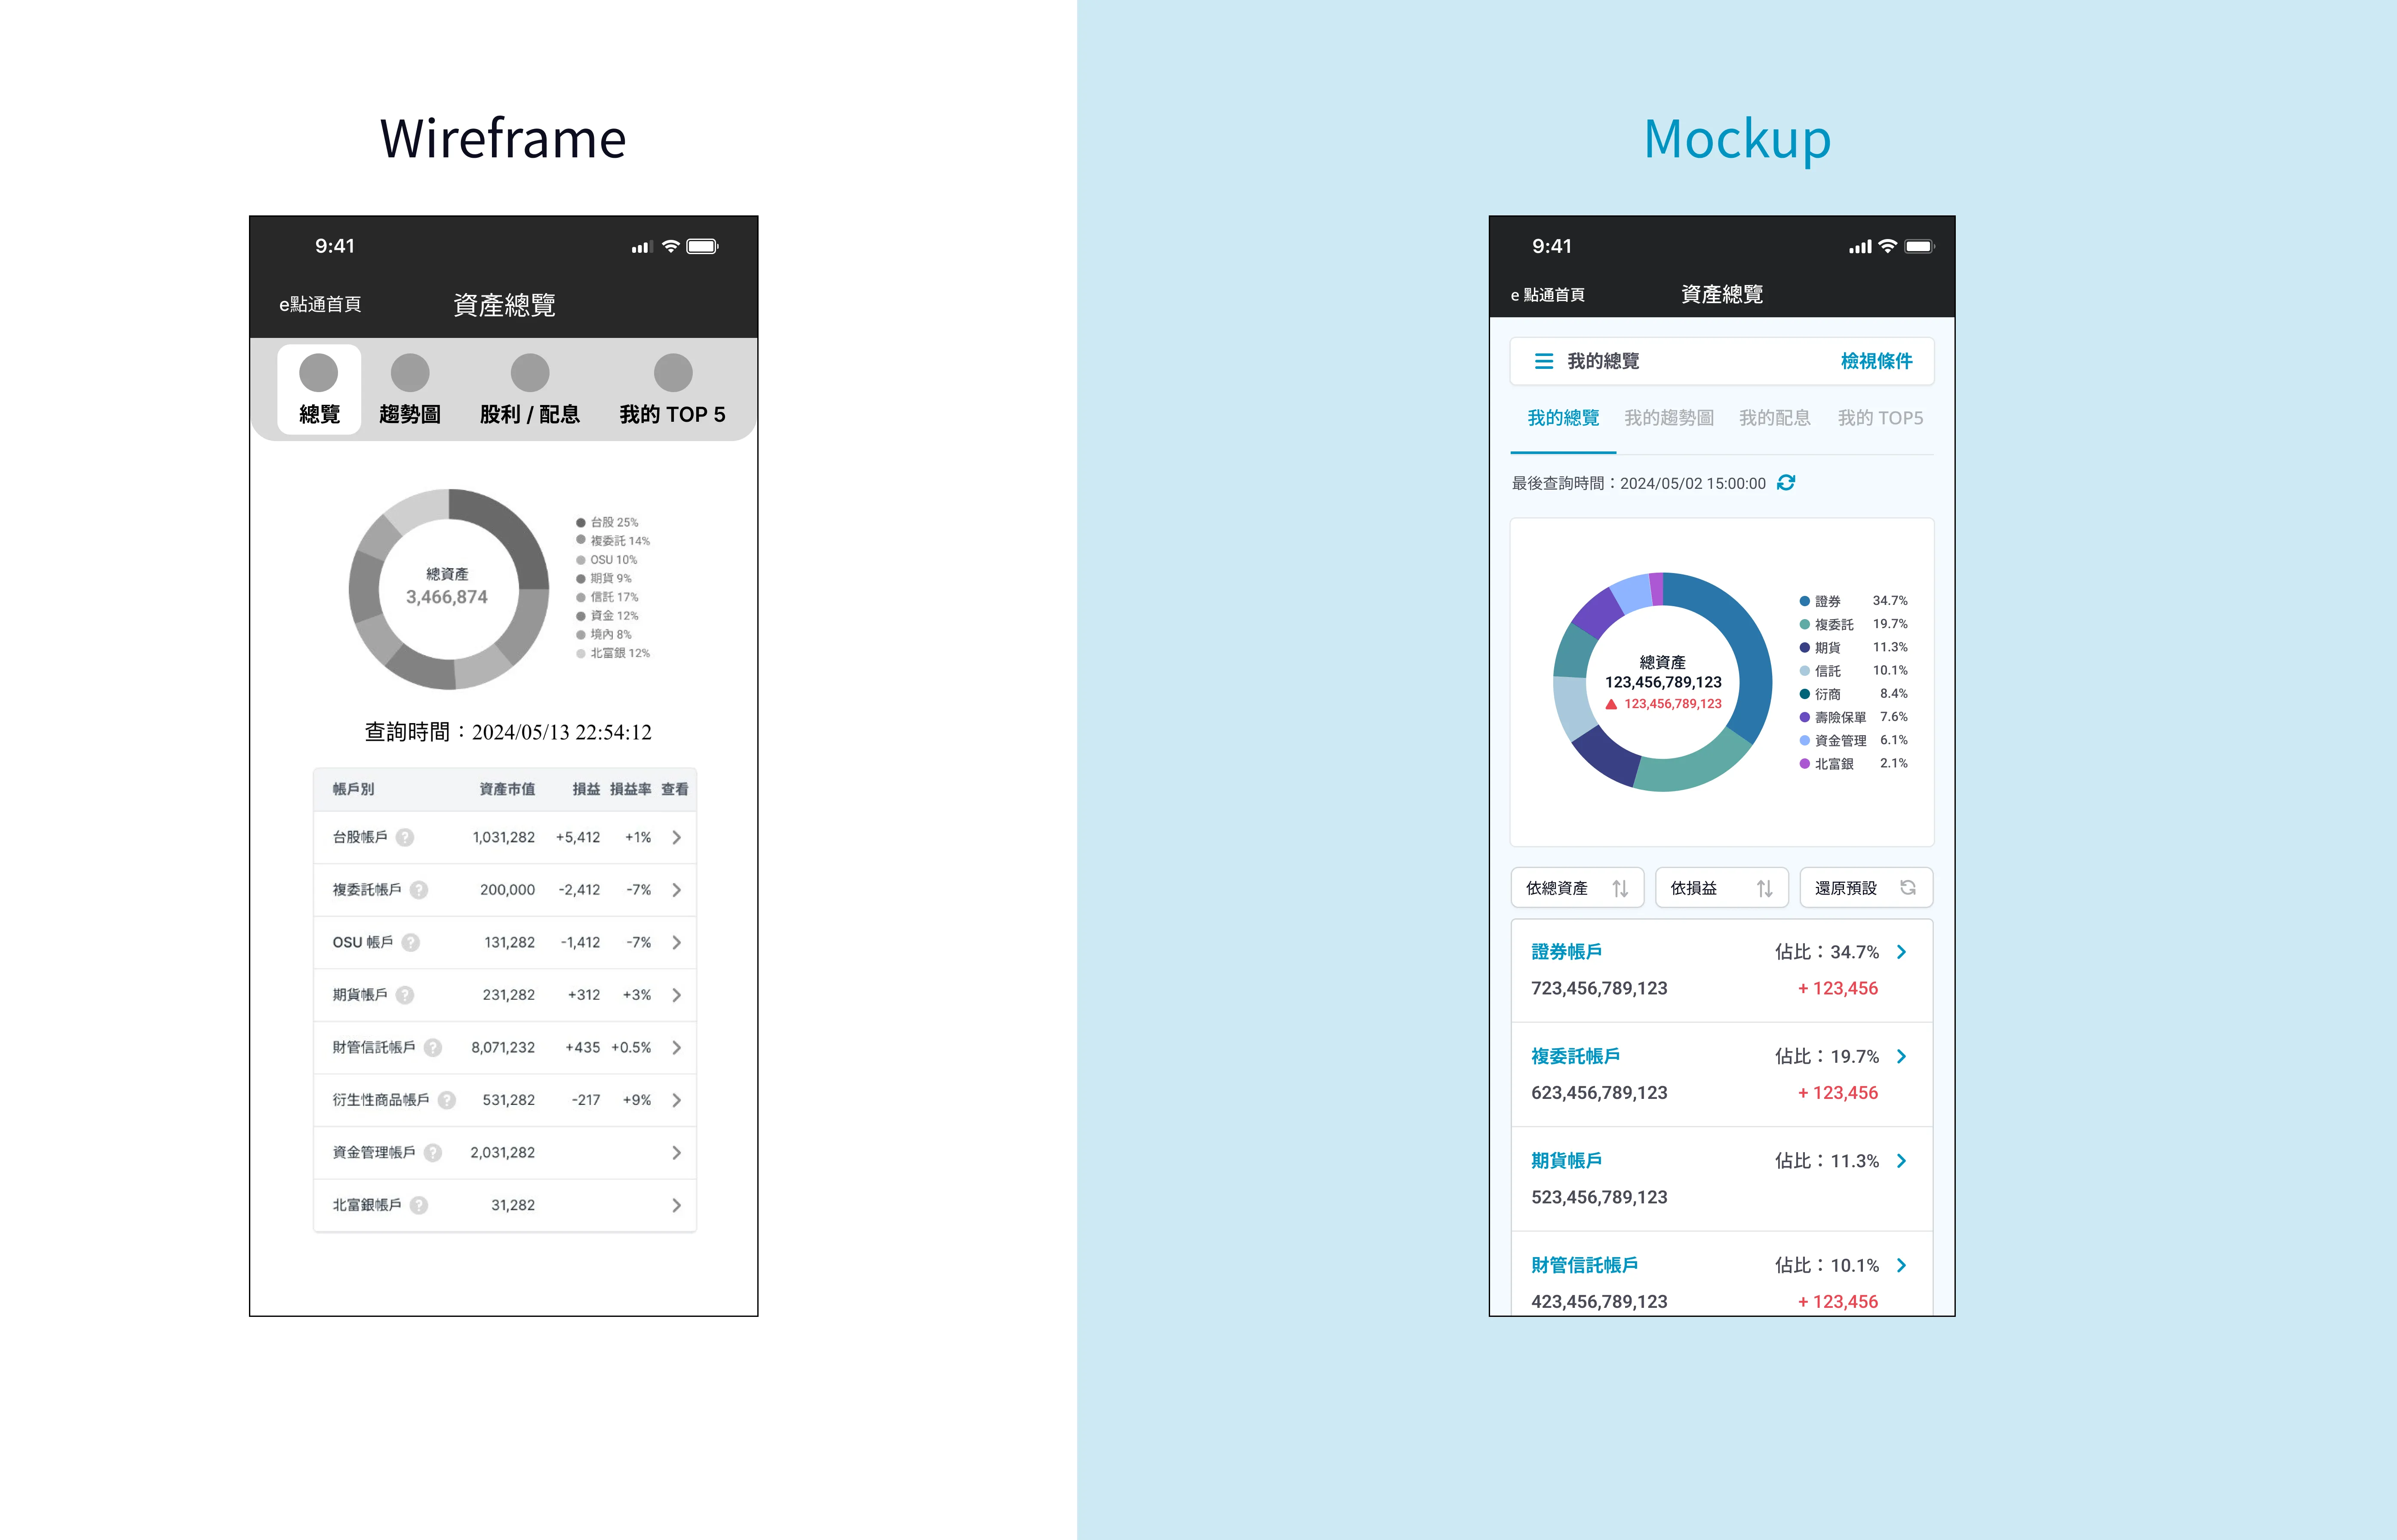
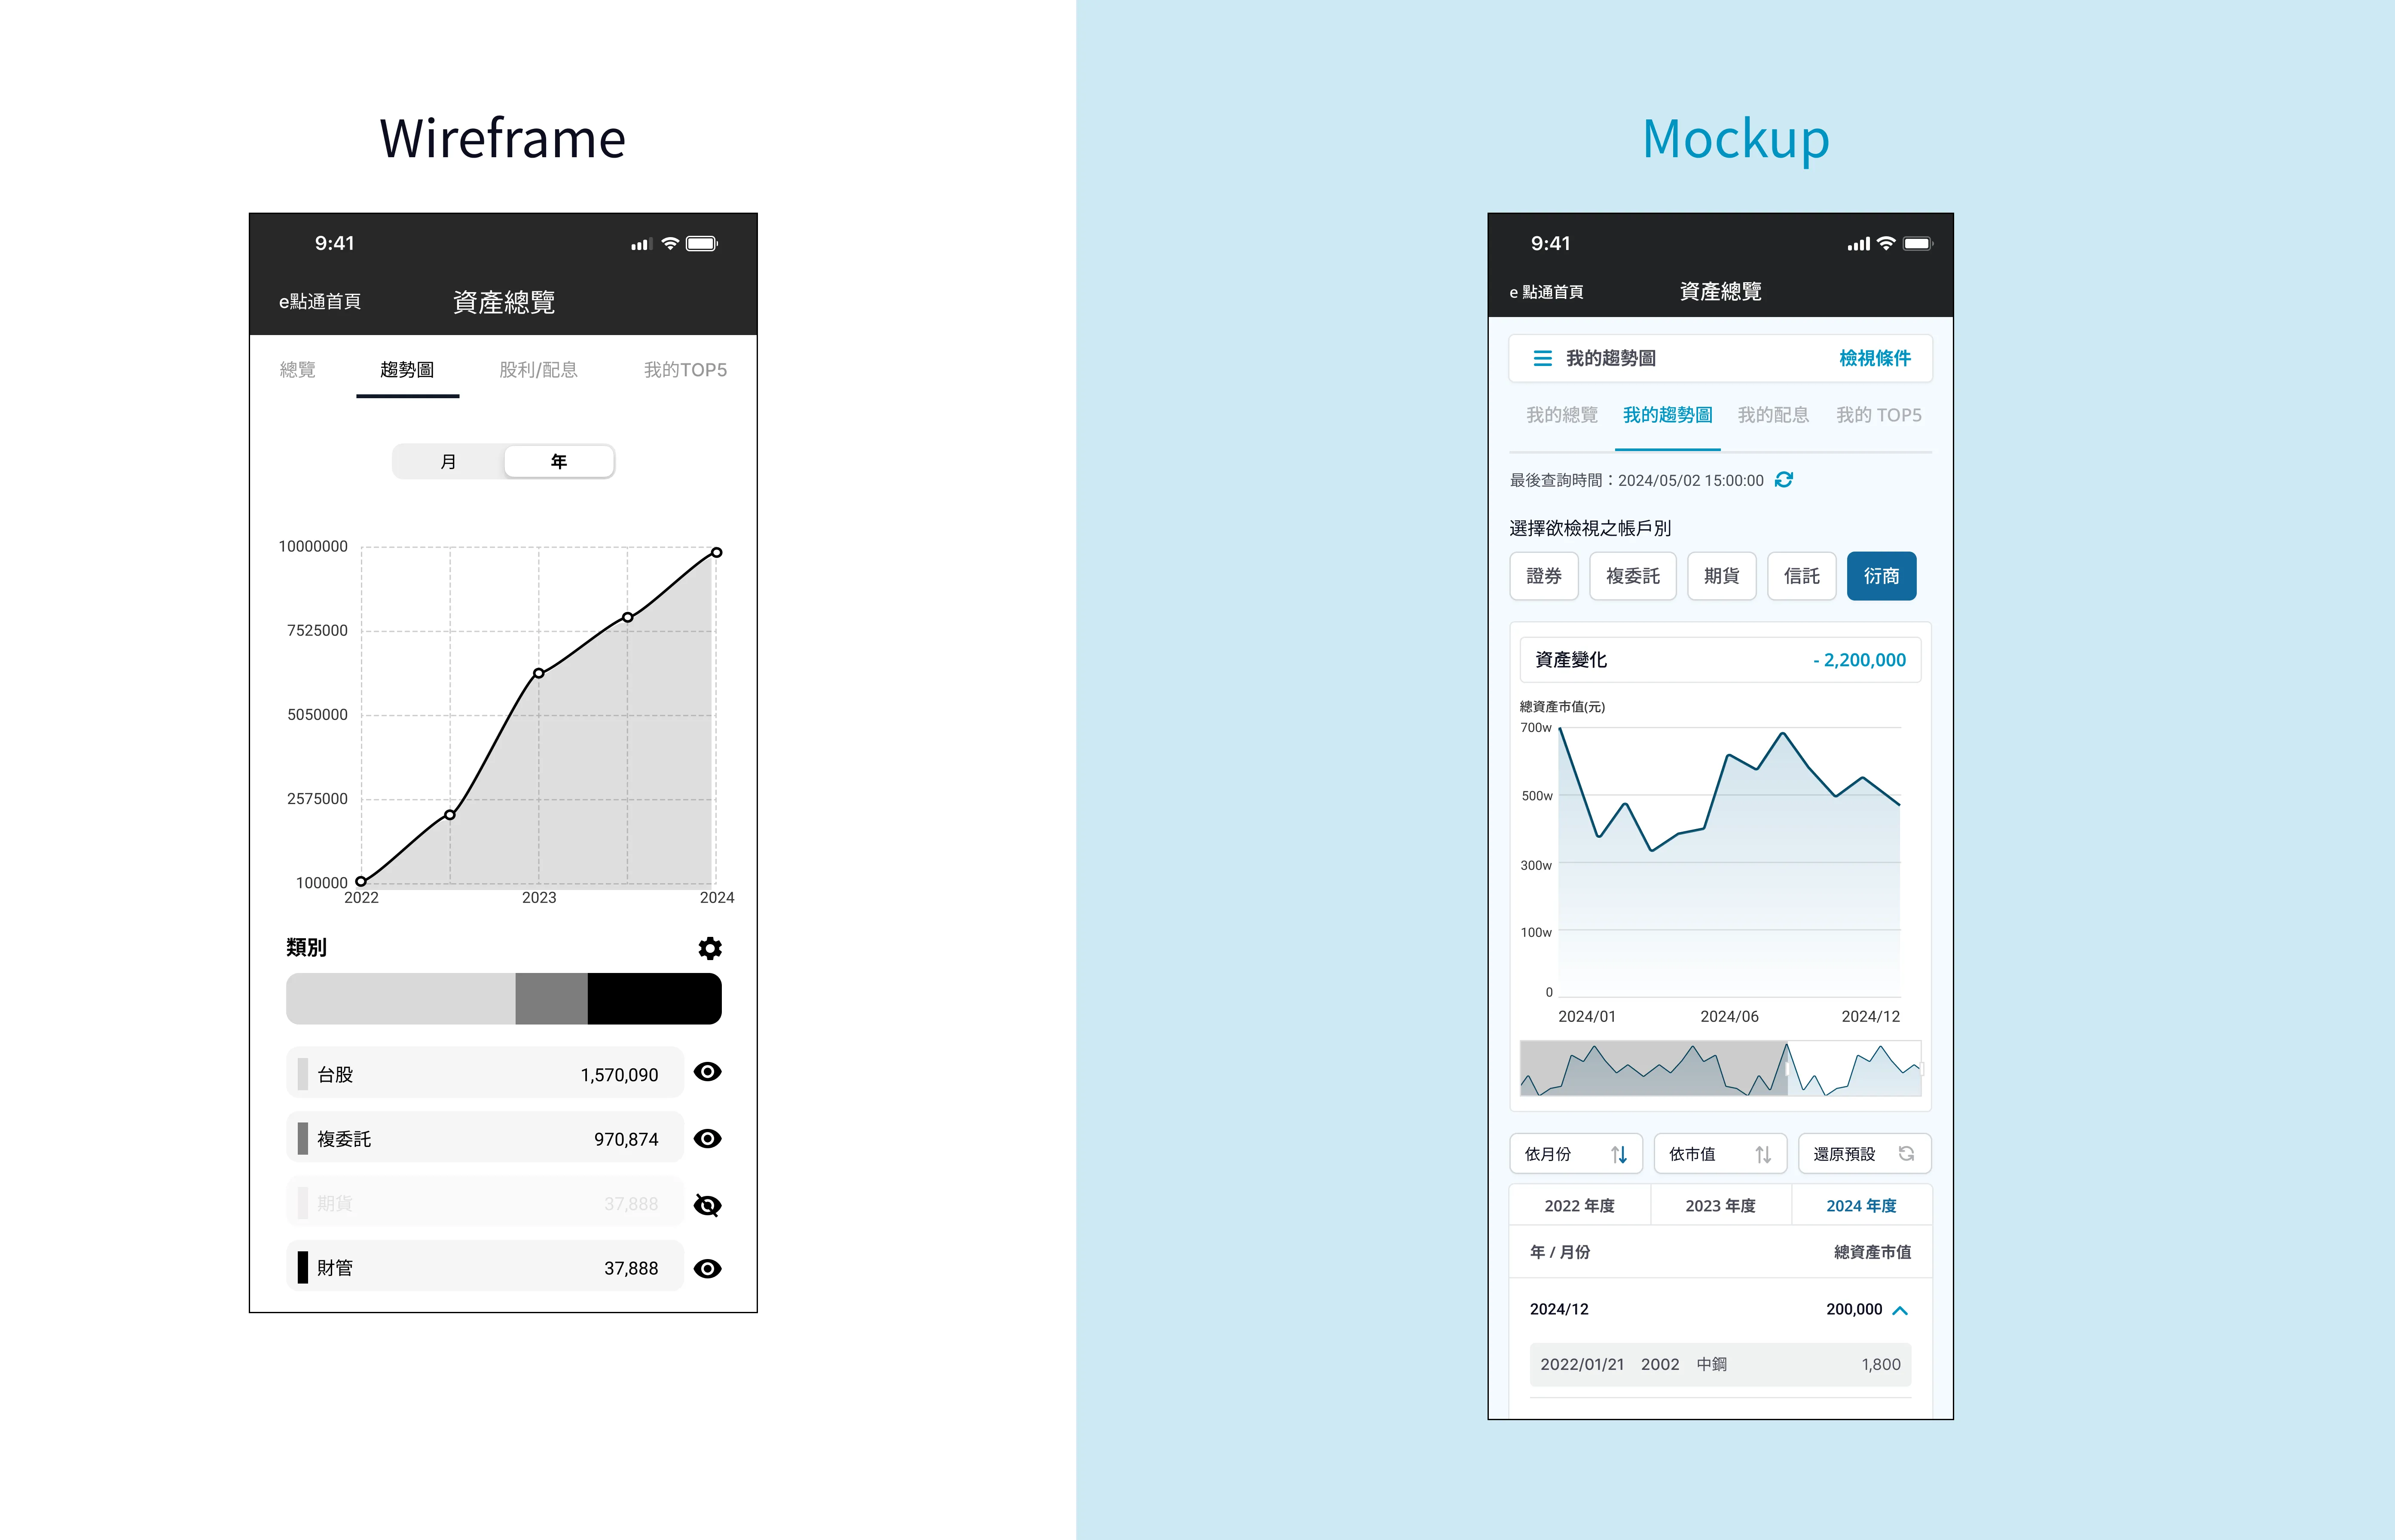
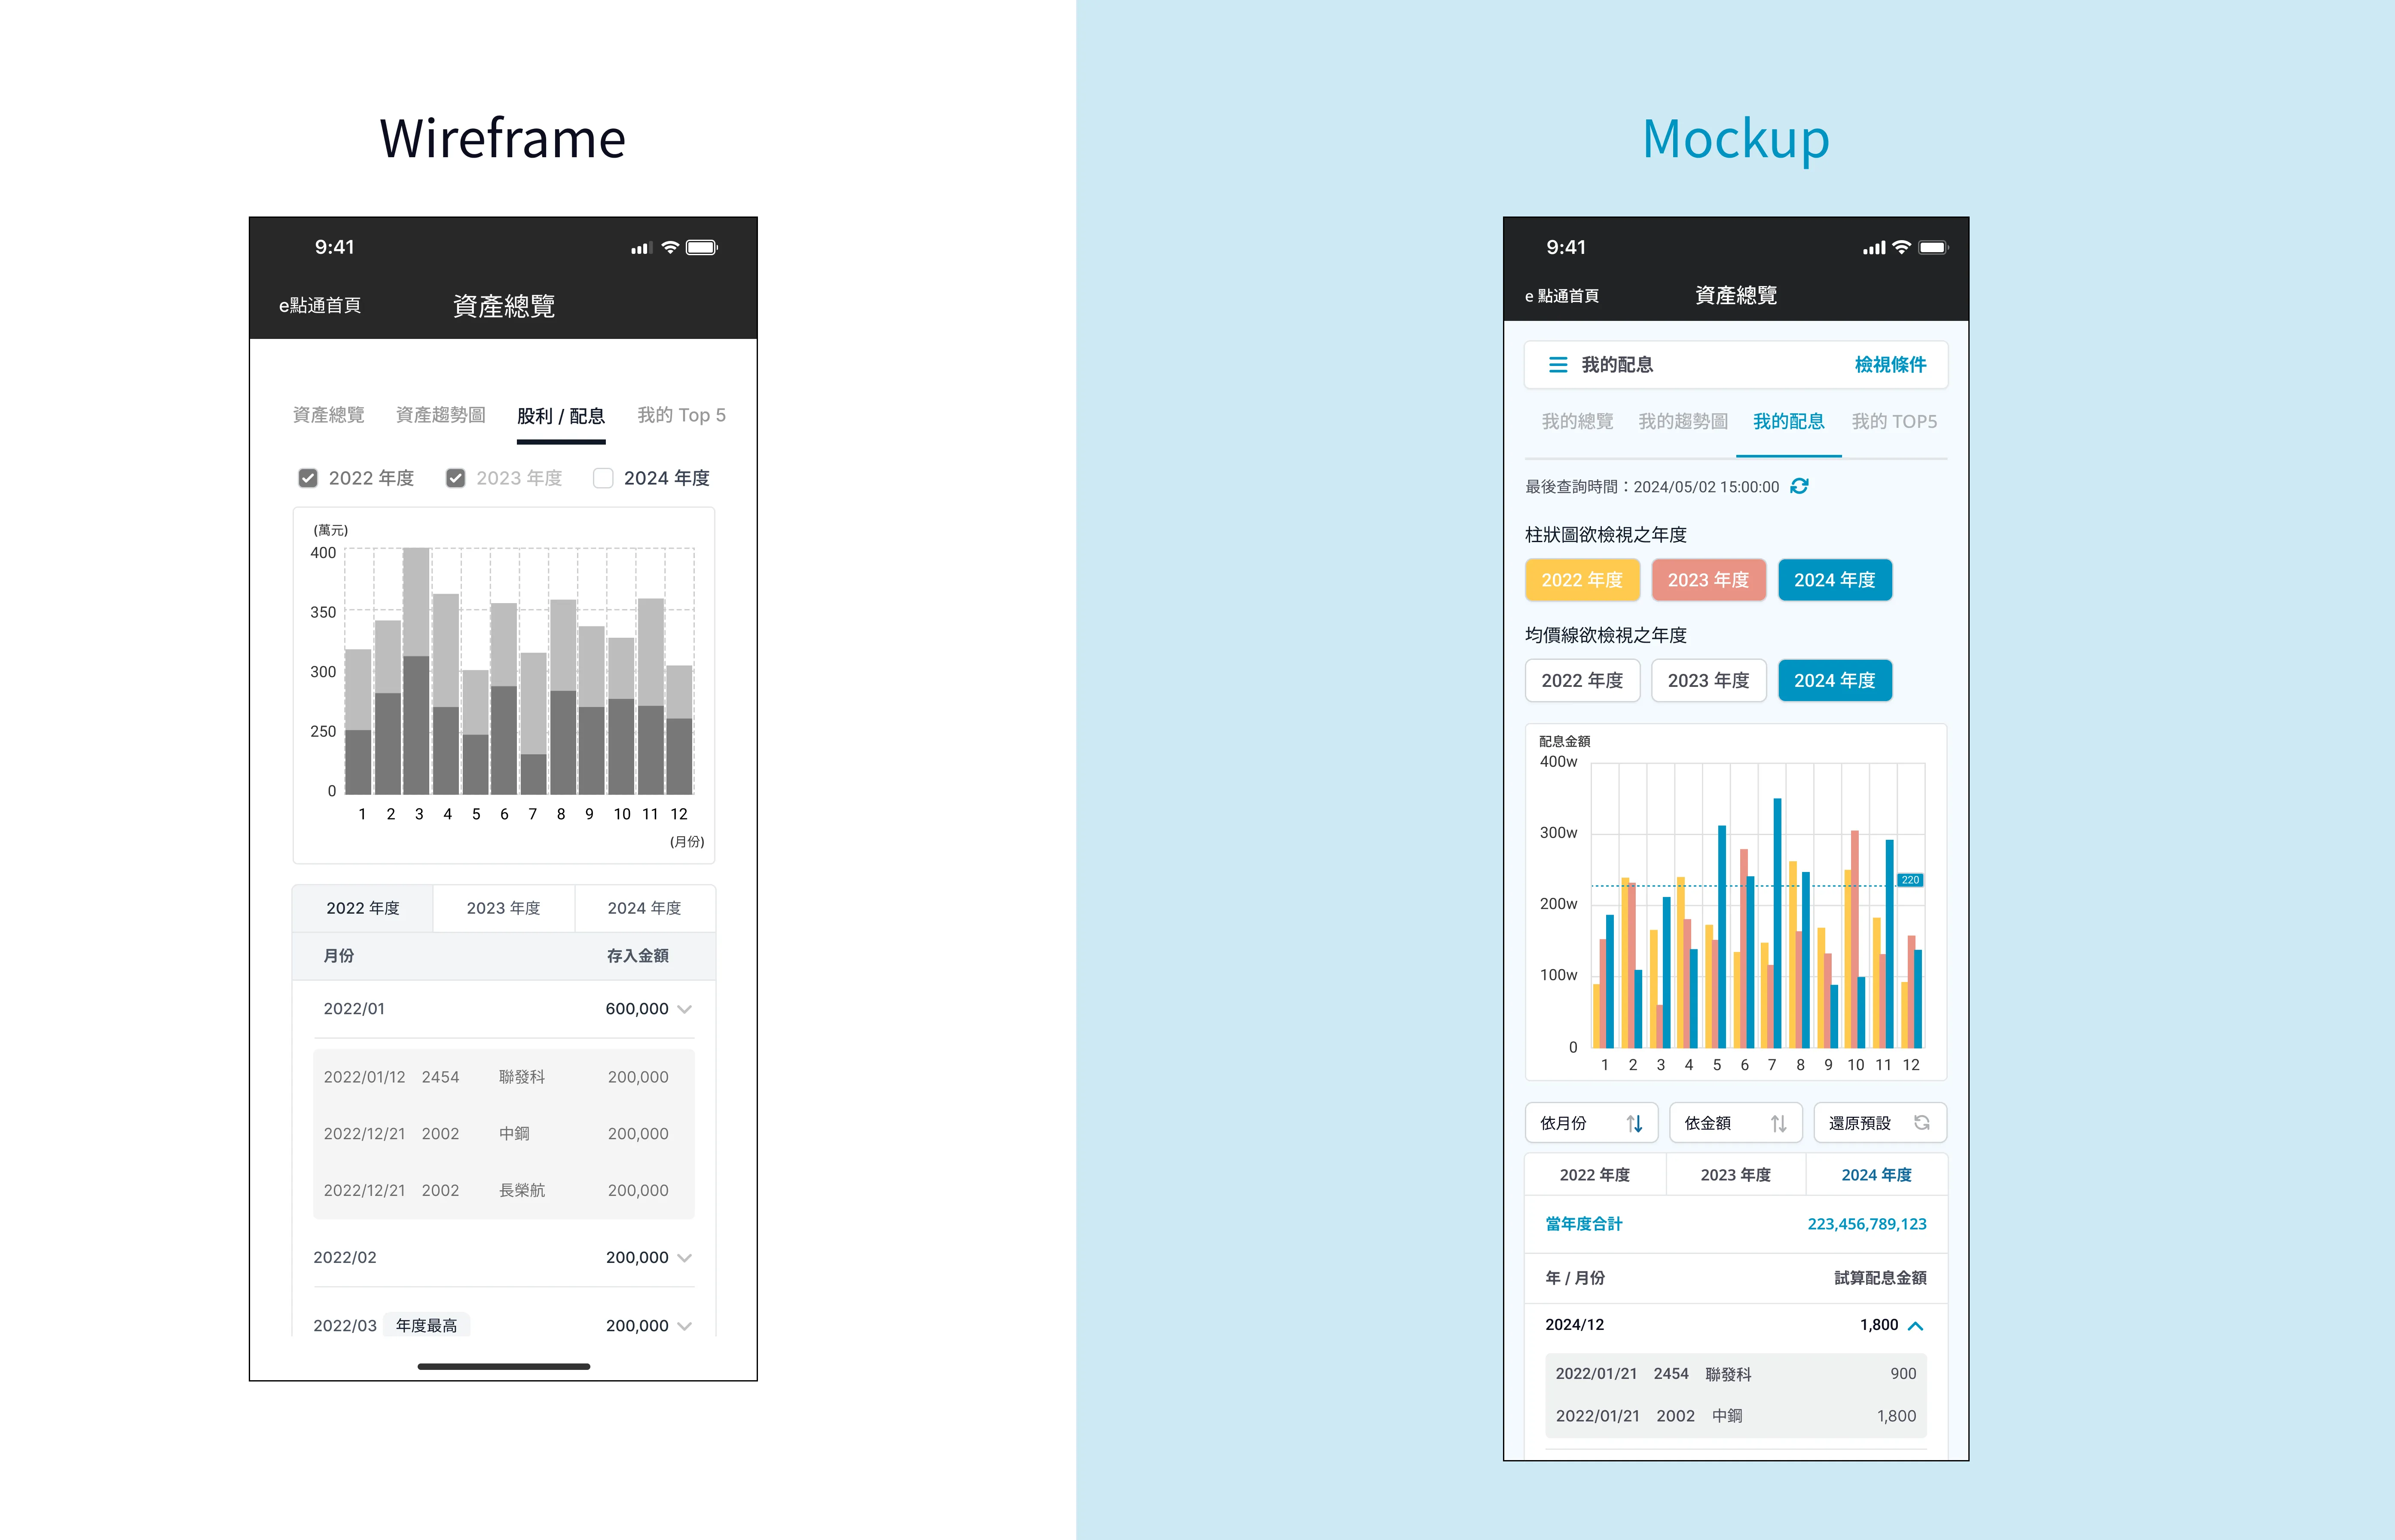
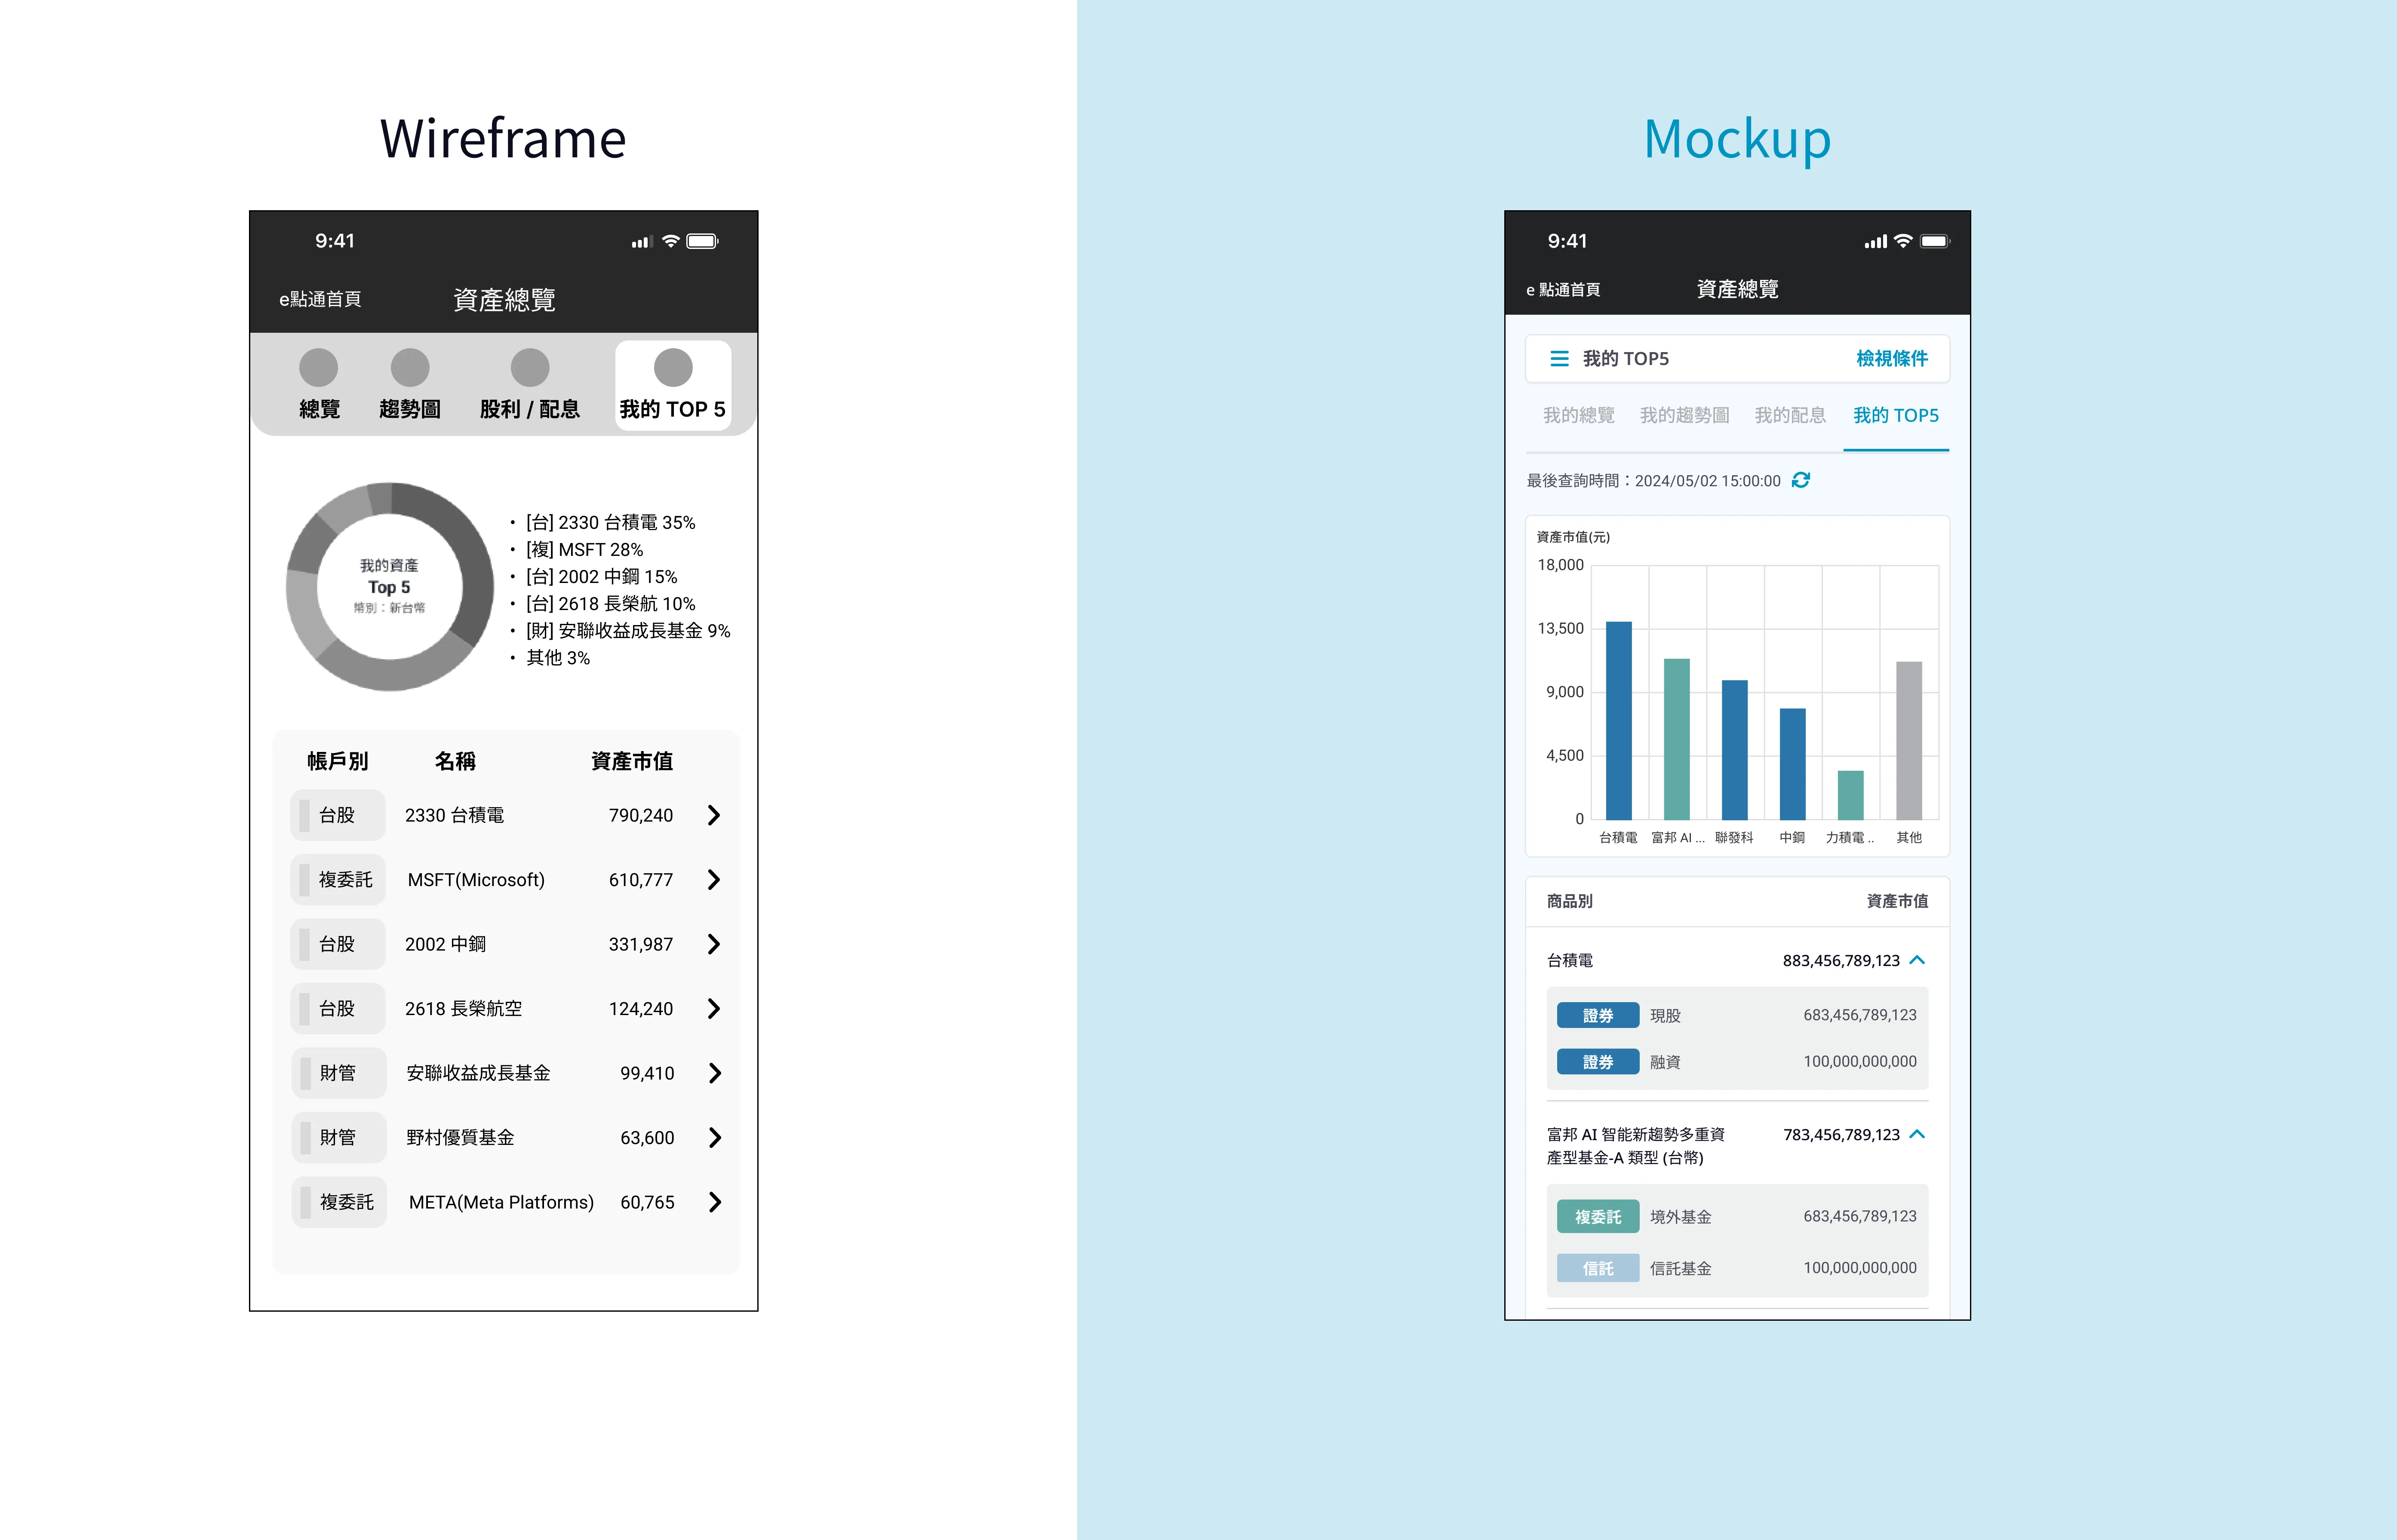
Because the preliminary research and data field definitions were executed so thoroughly,
there were minimal discrepancies between the initial wireframes and the final version. This
efficiency saved a significant amount of development time, which was strategically
reallocated to in-depth discussions with our vendor regarding visual styles, aesthetics, and
UI component attributes across key screens:
4. Additional Details
Beyond the core functionality, I also proactively accounted for various informational flows
and regulatory constraints:
- (1) Error states
- (2) System logout
- (3) Time out handling
- (4) Data Cache (Loading)
- (5) Personal data privacy
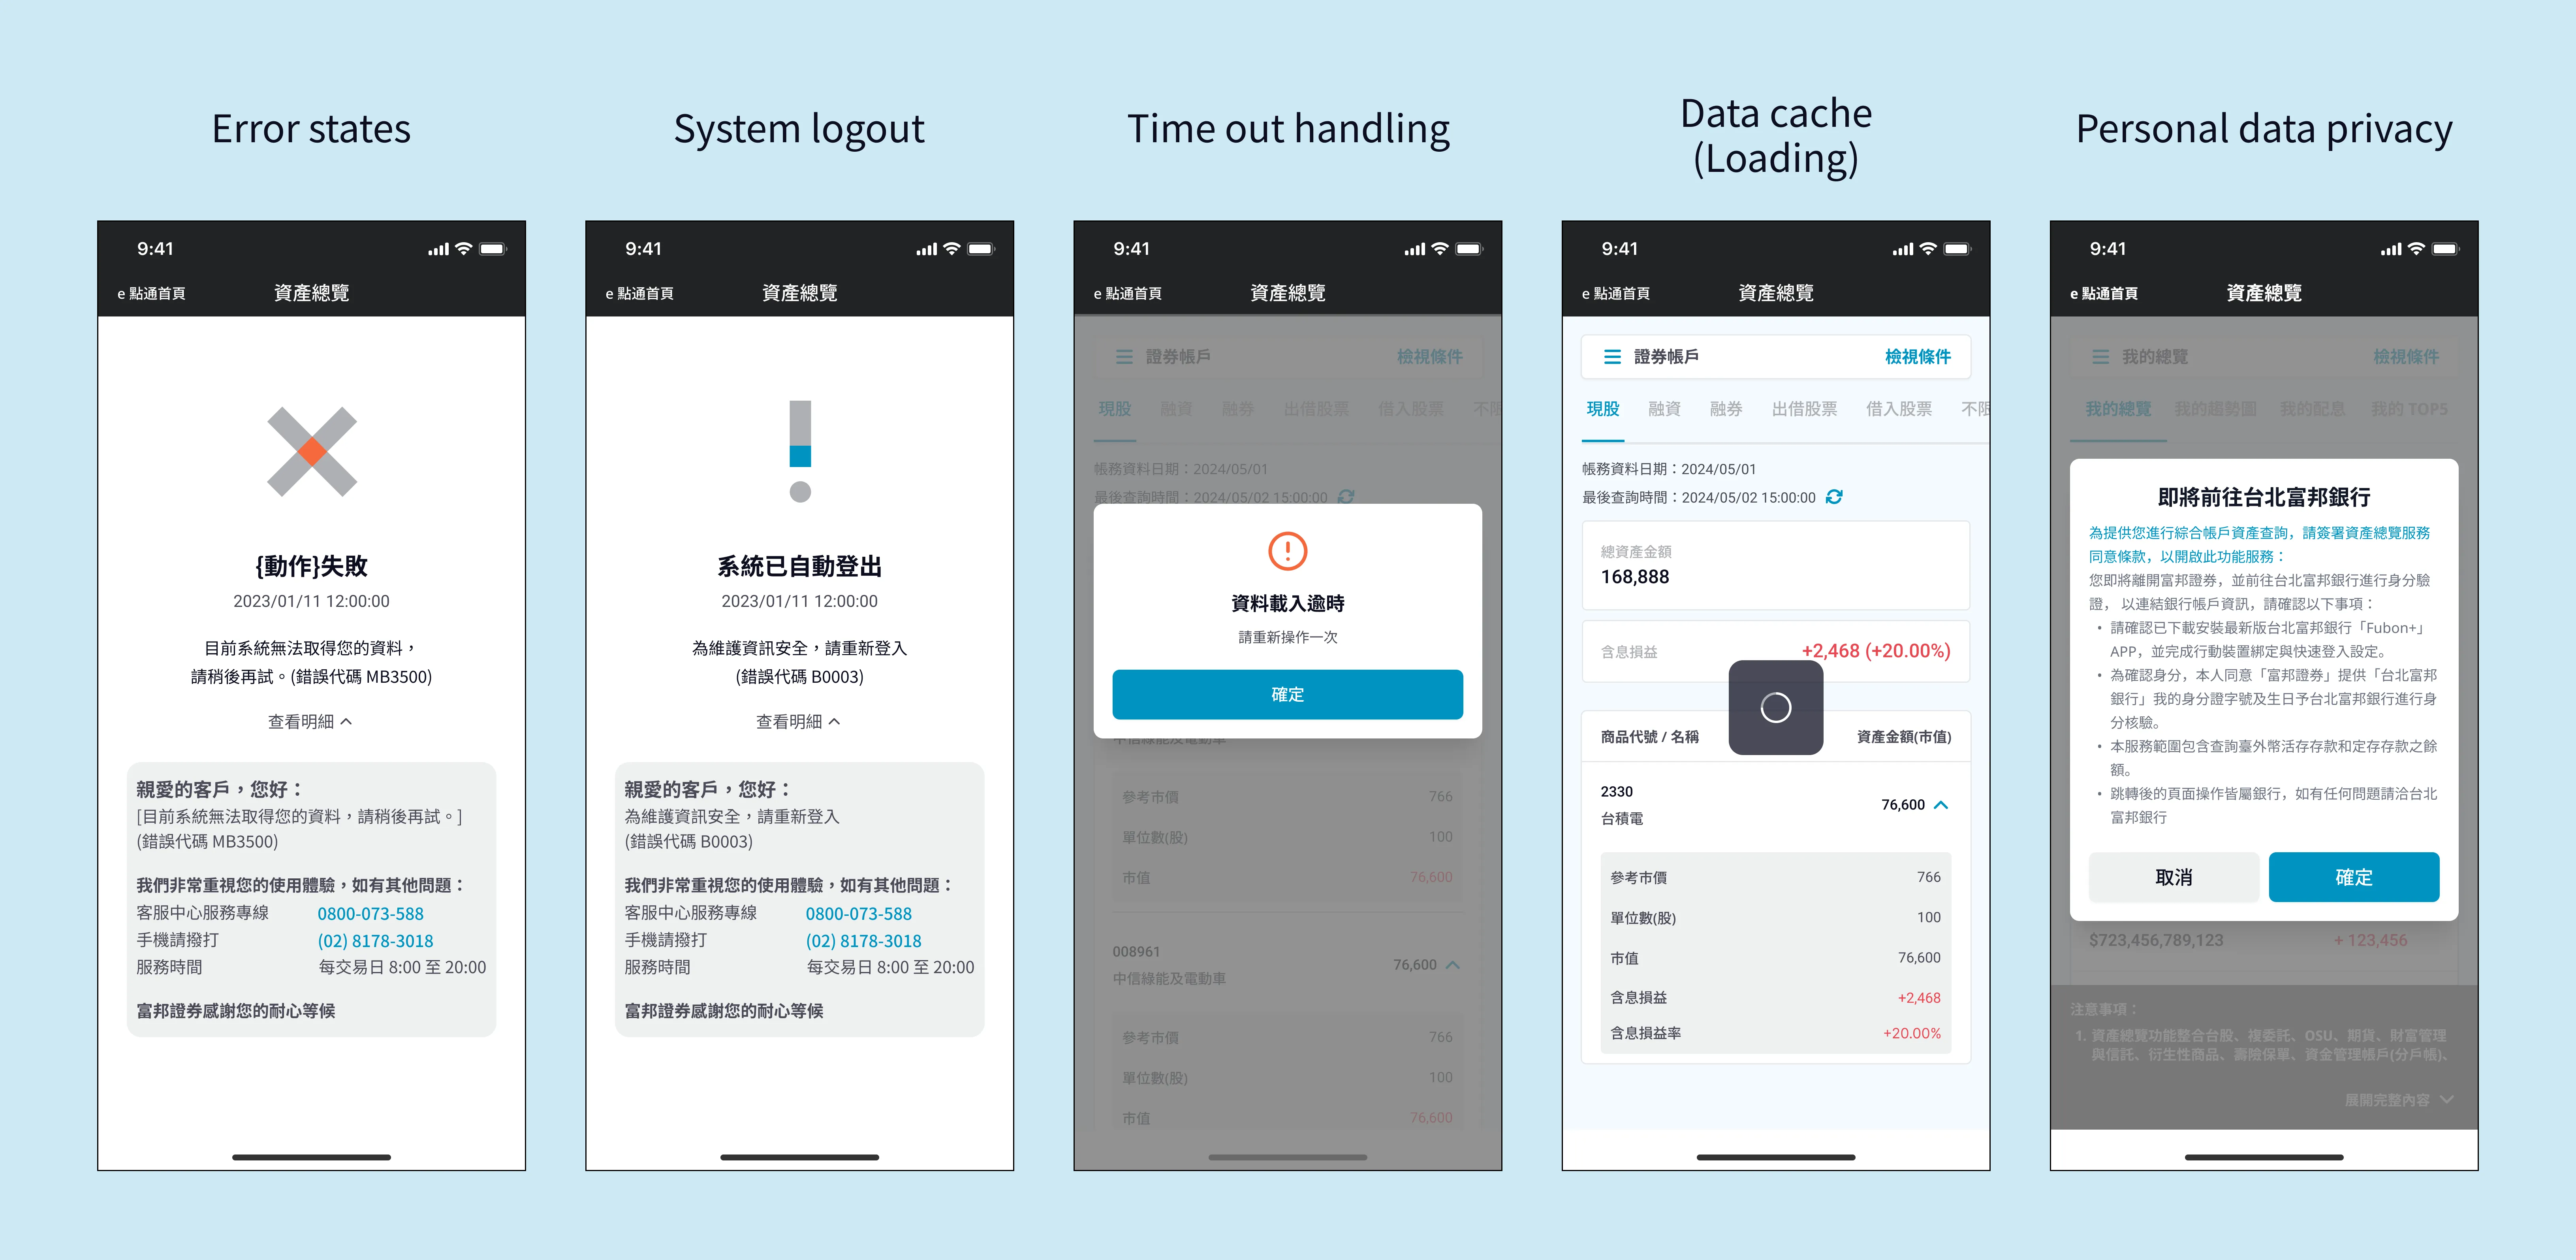
Additional Details


 Bill Chien-Ting Lu